ChainLadder package for R. It provides methods which are typically used in insurance claims reserving to forecast future claims payments. |
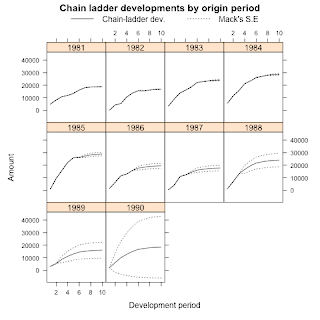
| Claims development and chain-ladder forecast of the RAA data set using the Mack method |
Initially the package came with implementations of the Mack-, Munich- and Bootstrap Chain-Ladder methods. Since version 0.1.3-3 it also provides general multivariate chain ladder models by Wayne Zhang. Version 0.1.4-0 introduced new functions on loss development factor fitting and Cape Cod by Daniel Murphy following a paper by David Clark. Version 0.1.5-0 has added loss reserving models within the generalized linear model framework following a paper by England P. and Verrall R. (1999) implemented by Wayne Zhang.
For more details see the project web site: http://code.google.com/p/chainladder/ and an early blog entry about R in the insurance industry.
Changes in version 0.1.5-1:
- Internal changes to
plot.MackChainLadderto pass new checks introduced by R 2.14.0. - Commented out unnecessary creation of 'io' matrix in
ClarkCapeCodfunction. Allows for analysis of very large matrices forCapeCodwithout running out of RAM. 'io' matrix is an integral part ofClarkLDF, and so remains in that function. -
plot.clarkmethod- Removed "conclusion" stated in
QQplotof clark methods. - Restore 'par' settings upon exit
- Slight change to the title
- Removed "conclusion" stated in
- Reduced the minimum 'theta' boundary for weibull growth function
- Added warnings to
as.triangleif origin or dev. period are not numeric
Here is a little example using the googleVis package to display the RAA claims development triangle:
library(ChainLadder)
library(googleVis)
data(RAA) # example data set of the ChainLadder package
class(RAA) <- "matrix" # change the class from triangle to matrix
df <- as.data.frame(t(RAA)) # coerce triangle into a data.frame
names(df) <- 1981 : 1990
df$dev <-  1:10
plot(gvisLineChart(df, "dev", options=list(gvis.editor="Edit me!", hAxis.title="dev. period")))


