Is R turning into an operating system?

Over the years I convinced my colleagues and IT guys that LaTeX/XeLaTeX is the way forward to produce lots of customer reports with individual data, charts, analysis and text. Success! But of course the operating system in the office is still MS Windows.

With my background in Solaris/Linux/Mac OSX I am still a little bit lost in the Windows world, when I have to do such simple tasks as finding and replacing a string in lots of files. Apparently the acronym is FART (find and replace text).

So, what to you do without your beloved command line tools and admin rights? Eventually you start using R instead. So here is my little work-around for replacing "Merry Christmas" with "Happy New Year" in lots of files:

for( f in filenames ){

x <- readLines(f)
y <- gsub( "Merry Christmas", "Happy New Year", x )
cat(y, file=f, sep="\n")

}
You can find a complete self-contained example on github.

Of course R is not an operating system, but yet it can complement it well, if your other resources are limited.

Last but not least: Happy New Year!

Clear As Mud

When is selling not selling? Where is the line between helping your customer and primarily helping yourself? Determining that becomes harder each day.

One of my clients needed to talk. She had received a disturbing phone call at her home and wanted to know if she had handled it correctly and if I knew the back story. Mary (not her real name) was contacted by a national pharmacy. We’ll call the pharmacy chain Mega Rx. Mary was advised that her insurer would no longer cover medications for her and her family from their local Mega Rx. Since they knew that Mary would hate to loose access to Mega Rx, they would be happy to connect her to someone who could help her find an insurance policy that would allow her to retain them. All she had to do was stay on the line. Mary thanked them but said that she already had an agent and hung up.

Think about this for a second. The national drug store chain had fought and lost a battle with a national insurer. They were mining their records for anyone who had that insurer and had had a prescription filled in the last year or so. And if Mary was gullible and not paying attention, she might have somehow been talked into different insurance that would have definitely covered Mega Rx, but might not have covered her doctor, or given her and her family the same level of coverage.

The appointment to change individual health insurance policies usually takes an hour in my office and involves a lot more than whether or not Mega Rx is in the network. This silliness is taking place under our current set of rules. The states and the federal government are still writing the new rules. Some people don’t think we really need licensed agents. Why not let anyone sell insurance?

I just spent twenty minutes completing my application to renew my license to sell life and health insurance. I had to prove that I had completed 21 hours of continuing education and 3 additional hours of ethics training in the last two years. I actually had a total of 42. That does not include the 7 to 9 hours per year for Medicare products or the mandatory additional training for long term care coverage. I then attested that I haven’t been convicted of any crimes, haven’t had my insurance license suspended or revoked, and that I don’t owe back child support. This is true. You can not sell insurance in the State of Ohio if you owe back child support. I paid my $5 and I should get an approval notice some time next week.

All states have seen a value in licensing insurance agents. It is obvious that one value of the requirements is to weed out the part-timers. The public is better served by committed professionals who are willing to take the time and effort to stay current. And though insurance agents (me included) will never be confused with rocket scientist, we do serve an important function in the market as we help the insured public acquire coverage and navigate the process to get the most from their contracts. The insurers long ago (begrudgingly) accepted our value.

This brings us to the Patient Protection and Affordable Care Act (PPACA). The authors of this legislation did not believe that the public is capable of calling an insurance agent or company or shopping online to purchase health insurance. Since finding health insurance was so difficult, insurance exchanges, a marketplace, would be created in each state. As you can see from the Obama administration’s website, the exchanges, an additional layer of bureaucracy, is going to save you money. And how will you get to the exchange and who is going to help you choose the right type of policy for you? That would be the Navigators.

The PPACA is pretty sure that almost anyone that can fog a mirror is capable of doing my job. Any employee of trade association or union can walk you through the process. In fact, the PPACA spends more time on the notion that the Navigators can not be compensated by the insurers than it does on training or qualifications.

A well publicized letter from David M. Casey, Senior Vice President of MAXIMUS, a company that specializes in Medicaid enrollment, details the Patient Protection and Affordable Care Act’s aversion to professional insurance agents.

John Doak, the Oklahoma Insurance Commissioner, is succinct in his judgment. He has consistently challenged the federal government’s intrusion into insurance regulation and health insurance. He has asked what kind of training the Navigators will have in insurance products, health information privacy regulations (HIPAA), or ethics. And of course we already knew the answer, none.

The other question is “Who will be paying the Navigators”? You have two choices. Either the Navigators eventually become employees of an endlessly growing government program, or they are employees of organizations who have something to gain by you and I being steered into one policy versus another. And that brings us back to Mega Rx. The major pharmacy chains are currently exploring ways to have employees become Navigators under the future exchange program. Will they be impartial? Will they be looking out for your best interest? Will the sun rise from the west tomorrow morning?

This is too easy and way too transparent a case of conflict of interest. What if a major insurer is donating money to your local trade group? The employee of that trade group would work to navigate people to that company’s policy. There is a lot of money involved. This won’t be subtle. And it won’t be easily traced.

So when you get that phone call from the drug store, or the doctor’s office, or the Chamber of Commerce, and you will one day, ask yourself why. Slow the process down and try to determine who is getting paid and for what.

In the interest of creating transparency and simplicity, we have failed at both.

DAVE

www.bcandb.com

Lynnwood auto repair shop charged with insurance fraud

A Snohomish County auto repair shop has been charged with insurance fraud after charging for repairs it didn't do and parts that it never installed.

Northwestern Collision, of Lynnwood, was charged Dec. 14 in Snohomish County Superior Court. Arraignment is set for Jan. 9.

In 2009, Farmers Insurance investigators inspected 11 vehicles that had been repaired by the shop between 2007 and 2009. Of the 11, 10 "had substantial and specific" deviations from the repair estimates that Farmers had agreed to.

Among the problems: parts missing and not replaced, repairs not performed, and repairing items that were supposed to be replaced.

On Dec. 8, 2010, officers from the state insurance commissioner's Special Investigations Unit, the State Patrol and the Snohomish County Sheriff's Office served a warrant at the company's Lynnwood office. They gathered up paper files on 10 of the 11 vehicles.

The records indicated that in some cases, new parts that were supposed to be installed were instead returned to the parts dealer.

The insurer was overcharged nearly $11,000, and had to buy one customer's car, which had been rendered unsafe to drive, for another $15,446.

Cease and desist order issued to TracGuard Services

The Washington state insurance commissioner's office has told a Florida-based vehicle service contract provider to stop selling unauthorized contracts in Washington state.

TracGuard Services LLC, Jose L. Terry and Alberto Tudela, all of North Miami, have been ordered "to immediately cease and desist from engaging in or transacting the unauthorized business of insurance" in Washington.

Neither the company nor the two men are authorized to solicit or transact insurance in the state. They have not registered as a motor vechicle service contract provider in Washington.

The three have been ordered to notify all Washington residents who have purchased a service contract from them. It also warns that, pursuant to Washington state law, unauthorized insurers "shall remain personally liable for performance of the contract."

Cease and desist order issued to Mill Creek man

A Mill Creek man and company have been ordered to stop selling unauthorized vehicle service contracts.

The order names Scott L. Stevens and RVProtection.net, Inc., both of Mill Creek, Wash. In August of 2010, they sold a consumer a vehicle service contract offered by Genuine Warranty Solutions, Inc.

The problem: Genuine Warranty Solutions, Inc. is not a registered vehicle service contract provider in Washington.

The Dec. 19 order took effect immediately. Stevens and the company have the right to appeal the order.

Public notices and hearings: Change of incorporation, proposed acquisition, etc.

Notices and upcoming hearings from our public notices web page:

Proposed acquisition: Humana is proposing to become the sole owner of Arcadian Management Services and its affiliates. We've completed our review of the application for acquisition of control. No hearing's been scheduled yet, but will be soon.

Incorporation change: The Safeco Companies have requested approval to have New Hampshire be their state of incorporation. The companies, which were acquired by Boston-based Liberty Mutual in 2008, say the change would not affect any Washington policyholders, and that there would be no interruption in coverage. A hearing is scheduled for Jan. 10, 2012 at 10 a.m. in our Tumwater office, which is at 5000 Capitol Blvd. Annual reports and other documents re: the request are posted here.

Change in port of entry/redomestication: Industrial Alliance Pacific Insurance and Financial Services have filed documents to change their port of entry/redomestication to Texas. A hearing is scheduled for Feb. 1, 2012 at 1 p.m. at our Tumwater office, which is at 5000 Capitol Blvd. Documents re: the request are posted here.

googleVis 0.2.13: new stepped area chart and improved geo charts

On 7th December Google published a new version of their Visualisation API. The new version adds a new chart type: Stepped Area Chart and provides improvements to Geo Chart. Now Geo Chart has similar functionality to Geo Map, but while Geo Map requires Flash, Geo Chart doesn't, as it renders SVG/VML graphics. So it also works on your iOS devices.

These new features have been added to the googleVis R package in version 0.2.13, which went live on CRAN a few days ago.

The function gvisSteppedAreaChart works very much in the same way as gvisAreaChart. Here is a little example:

library(googleVis)
df <- data.frame(country=c("US", "GB", "BR"),
val1=c(1,3,4), val2=c(23,12,32))
SteppedArea <- gvisSteppedAreaChart(df, xvar="country",
yvar=c("val1", "val2"),
options=list(isStacked=TRUE,
width=400, height=150))
plot(SteppedArea2)

The interface to gvisGeoChart changed slightly to take into account the new version of Geo Chart by Google. The argument numvar has been renamed to colorvar and a new argument sizevar has been added. This allows you to set the size and colour of the bubbles in displayMode='markers' depending on columns in your data frame. Further, you can set far more options than you could before, in particular you can set not only the region, but also the resolution of your map. Although more granular maps are not available for all countries, for more details see the Google documentation.

Here are two examples, plotting the test data CityPopularity with a Geo Chart. The first plot shows the popularity of New York, Boston, Miami, Chicago, Los Angeles and Houston on the US map, with the resolution set to 'metros' and region set to 'US'. The Google Map API makes the correct assumption about which cities we mean.

library(googleVis> ## requires googleVis version >= 0.2.13
gcus <- gvisGeoChart(CityPopularity,
locationvar="City", colorvar="Popularity",
options=list(displayMode="markers",
region="US", resolution="metros"),
chartid="GeoChart_US")
plot(gcus)

In the second example we set the region to 'US-TX', therefore Google will look for cities with the same names in Texas. And what a surprise, there are cities/towns named Chicago, Los Angeles, Miami, Boston and of course Houston in Texas.

gctx <- gvisGeoChart(CityPopularity, 
locationvar="City", colorvar="Popularity",
options=list(displayMode="markers",
region="US-TX", resolution="metros"),
chartid="GeoChart_TX")
plot(gctx)

With the new version of the Visualisation API Google introduced also the concept of DataTable Roles. This is an interesting idea, as it allows you to add context to the data, similar to the approach used with annotated time lines. Google classifies the DataTable Roles still experimental, but it is a space to watch and ideas on how this could be translated into R will be much appreciated.

And now the news of the googleVis package since version 0.2.10:

Version 0.2.13 [2011-12-19]
==========================

Changes

o The list of arguments for gvisGeoChart changed:
- the argument 'numvar' has been renamed to 'colorvar' to
reflect the updated Google API. Additionally gvisGeoChart
gained a new argument 'sizevar'.
o Updated googleVis vignette with a section on using googleVis
output in presentations
o Renamed demo EventListner to EventListener

NEW FEATURES

o Google published a new version of their Visualisation API on 7
December 2011. Some of the new features have been implemented
into googleVis already:
- New stepped area chart function gvisSteppedAreaChart
- gvisGeoChart has a new marker mode, similar to the mode in
gvisGeoMap. See example(gvisGeoChart) for the new
functionalities.

Version 0.2.12 [2011-12-07]
==========================

Bug Fixes

o gvisMotionChart didn't display data with special characters,
e.g. spaces, &, %, in column names correctly.
Thanks to Alexander Holcroft for reporting this issue.

Version 0.2.11 [2011-11-16]
==========================

Changes

o Updated vignette and documentation with instructions on changing
the Flash security settings to display Flash charts locally.
Thanks to Tony Breyal.
o New example to plot weekly data with gvisMotionChart
o Removed local copies of gadget files to reduce package file
size. A local copy of the R script to generate the original gadget
files is still included in inst/gadgets

Version 0.2.10 [2011-09-24]
==========================

Changes

o Updated section 'Using googleVis output with Google Sites,
Blogger, etc.' vignette

o Updated example for gvisMotionChart, showing how the initial
chart setting can be changed, e.g to display a line chart.

o New example for gvisAnnotatedTimeLine, showing how to shade
areas. Thanks to Mike Silberbauer for providing the initial code.

NEW FEATURES

o New demo WorldBank. It demonstrates how country level data can
be accessed from the World Bank via their API and displayed with a
Motion Chart. Inspired by Google's Public Data Explorer, see
http://www.google.com/publicdata/home

Judge issues insurance fraud ruling...in the form of a poem

And now for something completely different:

A Pennsylvania judge has issued a ruling in an insurance fraud case. What's unusual is that the judge issued his ruling in the form of a poem. From the Associated Press:
Justice J. Michael Eakin, writing for a 4-2 majority, concluded in six-line stanzas that a man's attempt to deposit a forged check appearing to be from State Farm didn't constitute insurance fraud.
"Sentenced on the other crimes, he surely won't go free, but we find he can't be guilty of this final felony," Eakin wrote. "Convictions for the forgery and theft are approbated — the sentence for insurance fraud, however, is vacated. The case must be remanded for resentencing, we find, so the trial judge may impose the result he originally had in mind."
A 3-page dissent by another judge, AP writer Marc Levy noted, did not rhyme.

GEICO fined $100,000 for overcharging customers in WA; company will also refund $7.5 million

A Maryland-based insurance company has been fined $100,000 after overcharging thousands of its Washington state customers.
The insurer, GEICO, is also refunding $7.5 million – plus 8 percent interest -- to the 25,267 affected auto insurance consumers by the end of the year.

“A computer database error caused the problem, which the company reported to us promptly,” said Washington State Insurance Commissioner Mike Kreidler. “GEICO has also agreed to a two-year compliance plan that includes multiple audits.”

An additional $50,000 fine was suspended, on the condition that the company abides by the terms of the compliance plan.

The refunds, many of which have already been paid, will average roughly $300. The company has been contacting active and former customers affected by the issue and expects to have all refunds paid by the end of the year.

On May 26, 2011, GEICO representatives self-reported the computer error, which resulted in 7 percent of the company’s Washington customers being overcharged for insurance between Aug. 24, 2009 and June 2011.

Fines collected by the insurance commissioner’s office do not go to the agency. The money is deposited in the state’s general fund to pay for other state services.

The complete order is posted at: http://www.insurance.wa.gov/oicfiles/orders/2011orders/11-0273.pdf.

Social media, liability and insurance

Social media and insurance? Hard to imagine those words together, but the new report by the Insurance Information Institute is pretty interesting reading.

Most of us rely on social media more and more these days - whether for work or to keep with friends and family. But we probably never think about the insurance impact (ie. liability issues).

Find out if you or your business could be at risk - here's the report.

The Day After The House Burned Down

This is a post about someone with cancer. I have not met Ms. Ward, nor do I think that I ever will, but I wish her a successful recovery. This post may take issue with some of her choices and many of her conclusions. These differences should not be interpreted as personal. They are not. Too many of our discussions have devolved into the personal as they abandon fact and reason. This blog champions a polite discussion of the facts.

Spike Dolomite Ward has cancer. Ms. Ward is a forty-nine year old married mother of two. She lives in California. This past Sunday’s Plain Dealer included an article she wrote that initially appeared in the Los Angeles Times. Ms. Ward explained why she hasn’t had health insurance for over two years. Trust her, it is not her fault.

The key element, the point that requires ten paragraphs to justify, is that she has been saved by President Obama and the Patient Protection and Affordable Care Act (PPACA). How you ask? Will the President be administering the Chemo? No, but close. As we have discussed before, the PPACA included the creation of guaranteed issue policies that cover pre-existing conditions for people who have been uninsured for over six months.

  • Significant medical condition like cancer? Check.

  • About to have lots of expensive treatments? Check.

  • Uninsured for over six months? Check.

  • Insurance now seems like a really, really good idea? CHECK.


I completely understand the need to purchase homeowners insurance now that my house has burned to the ground.

Please read Ms. Ward’s article. It is entirely possible that the laws in California are very different from those here in Ohio. It is also possible that there is a touch of exaggeration and hyperbole in those first ten paragraphs. Don’t get lost in the details. They aren’t relevant. This post is about the uninsured and the individual mandate.

We are, or at least should be, responsible for our choices. Ms. Ward is not alone. There are millions of uninsured Americans. The poor have Medicaid, a program that should have received a lot more attention in the last two years. It is the working poor that are falling through our system’s cracks. There is also a large segment of the population who simply choose to spend the money on other stuff. I refuse to speculate as to Ms. Ward and her family’s status.

Ms. Ward is correct. Her life choices, her insurance choices, her and her husband’s job choices could have had devastating consequences. Instead, someone else, you, will pay the bills. Any solution that includes guaranteed issue and the complete coverage of preexisting conditions must include a mandate that requires everyone to have insurance.

The individual mandate has been both championed and disparaged by everyone from Newt Gingrich to Barack Obama. One day they embrace it. The next day they flee from the concept. As an agent, as someone in the system for thirty-three years, I am convinced that requiring people to participate is the only way a guaranteed issue plan would work. This is not limited to private insurance programs. A government plan is just as dependent on universal participation. That is why Medicare Part B and Part D penalize late enrollees.

All of the candidates expressed their hatred of the individual mandate at last week’s Republican debate. I understand. They are running for president. But the time has come to stop telling us that you hate “Obamacare” and to instead offer a realistic alternative. Better yet, there are lots of serious people waiting to hear any viable option that doesn’t include an individual mandate.

Whether or not an alternative is ever proposed and passed, we wish a full and speedy recovery to Ms. Ward. And we wonder how in the world we can afford all of the other Spike Dolomite Wards we are going to be supporting.

Data is the new gold

We need more data journalism. How else will we find the nuggets of data and information worth reading?

Life should become easier for data journalists, as the Guardian, one of the data journalism pioneers, points out in this article about the new open data initiative of the European Union (EU). The aims of the EU's open data strategy are bold. Data is seen as the new gold of the digital age. The EU is estimating that public data is already generating economic value of €32bn each year, with growth potential to €70bn, if more data will be made available. Here is the link to the press statement, which I highly recommend reading:

EUROPA - Press Releases - Neelie Kroes Vice-President of the European Commission responsible for the Digital Agenda, Data is the new gold, Opening Remarks, Press Conference on Open Data Strategy Brussels, 12th December 2011


I am particularly impressed that the EU even aims to harmonise the way data will be published by the various bodies. We know that working with data, open or proprietary, often means spending a lot of time on cleaning, reshaping and transforming it, in order to join it with other sources and to make sense out of it.

Data standards would really help in this respect. And the EU is pushing this as well. I can observe this in the insurance industry already, where new European regulatory requirements (Solvency II) force companies to increase their data management capabilities. This is often a huge investment and has to be seen as a long term project.

Although the press statement doesn't mention anything about open source software projects, I think that they are essential for unfolding the full potential of open data.

Open source projects like R provide a platform to share new ideas. I'd say that R, but equally other languages as well, provide interfaces between minds and hands. Packages, libraries, etc. make it possible to spread ideas and knowledge. Having access to scientific papers is great but being able to test the ideas in practice accelerates the time it takes to embed new developments from academia into the business world.

Number of uninsured in WA hits 1 million

We posted a report this morning detailing our estimates of the number of Washingtonians with no health insurance, the amount of uncompensated care, and how those numbers are trending.

The upshot: We calculate that:
  • The number of uninsured has reached 1 million, or 14.5 percent of the state's population.
  • Uncompensated care (bad debt and charity care at hospitals, clinics, etc.) is nearly $1 billion.
  • And that both numbers are likely to continue to rise until 2014, when the major provisions of federal health care reform are slated to take effect.
  • The percentage of residents without health coverage worsened in 31 of 39 counties.
  • In several counties, more than 1 in 5 residents has no health coverage.
“This is a grim milestone for the state, and we believe the situation will remain bleak for two more years,” said Kreidler. “But it’s important for people to know that there is hope is on the horizon.”

Counties with a particularly high percentage of uninsured residents include: Adams, Grant, Okanogan, Franklin and Yakima. But the problem also worsened in King, Pierce, Snohomish and Spokane counties.

The good news: Assuming that federal health care reform takes effect as planned, more than 800,000 uninsured Washingtonians will be eligible in 2014 for expanded Medicaid eligibility or subsidies to help low- and middle-income families pay for health coverage.

This is the third report on the uninsured our office has put out since 2006.

LondonR, 6 December 2011

The London R user group met again last Wednesday at the Shooting Star pub. And it was busy. More than 80 people had turned up. Was it the free beer and food, sponsored by Mango, which attracted the folks or the speakers? Or the venue? James Long, who organises the Chicago R user group meetings and who gave gave the first talk that night, noted that to his knowledge only the London and Chicago R users would meet in a pub.


However, it were the speakers and their talks which attracted me:
You will notice that this London R meeting had a theme around risk pricing. James talked about reinsurance pricing using R in the cloud, while Chibisi focused more on personal lines insurance with generalised linear models and Richard came from the angle of investment management and portfolio optimisation.

A $200,000 patio cover? Spokane man charged with insurance fraud

A Spokane man has been charged with insurance fraud and attempted theft after a snow-damaged patio cover worth about $4,000 mushroomed into a nearly $200,000 claim.

Keith R. Scribner, 47, was arraigned Monday in Spokane County Superior Court on one count of insurance fraud and one count of attempted theft.

In late July 2009, Scribner's mother, Marilyn Warsinske, filed a claim with Liberty Mutual insurance. She said a patio roof at a home she'd purchased had collapsed due to the weight of snow some 6 months earlier. The policy covered "like kind and quality" replacement. Her son, she told the company, would handle the claim.

Scribner told the insurance company that patio cover was an extensive structure, spanning the entire length of the patio and wrapping around the home's chimney. Claims officials, inspecting the site, wondered why was there no flashing or holes in the masonry. Scribner said that house painters must have made repairs.

He sent the insurance company three bids to replace the cover based on his description. The bids ranged from $195,586 to $213,815.

Claims officials asked Scribner for any photos of the roof prior to the damage or after it collapsed. Perhaps some were taken during a home appraisal prior to the purchase, they suggested. Scribner said there were no photos and was no appraisal.

But a claims handler discovered an aerial photo of the home on a real estate website. It showed a much smaller patio cover than Scribner claimed.

The company launched a fraud investigation and notified Insurance Commissioner Mike Kreidler's anti-fraud Special Investigations Unit.

As it turned out, there had been a home appraisal, the investigators discovered. In fact, Keith Scribner met with the appraiser. And the appraisal included photos of the patio cover. A real estate agent interviewed by investigators described the cover as being "small and nothing special or significant."

The home's previous owner also provided photographs of the structure. It was originally canvas. When that because troublesome to remove each year, the homeowner bought a polycarbonate cover. Cost: About $300.

An architect told a state fraud investigator that he'd met with Scribner in 2008 -- months before the snow collapse -- to discuss plans to replace the deck cover with new, larger one.

A local company, provided with measurements and photographs of the original structure, drew up replacement bids at the request of a state fraud investigator. The bids: $3,913 and $4,782.

Insurance problem? We can help

We're the state agency that regulates insurance in Washington state. If you're a Washingtonian, we're happy to help answer insurance questions and help try to solve problems with insurers/agents/etc.

What can you expect? If you file a complaint, for example, we will:

■ Contact the insurance company regarding your concerns, review their response, and share the results of our review with you.


■ Research and complete your complaint within 60 days.

■ Suggest steps you might take to resolve your issue.

■ Make your complaint a part of the company's public record.

■ Require the company to address your concerns and follow Washington state insurance laws and regulations.

And we get results. We get millions of dollars a year in delayed or denied claims paid to Washington consumers.

For a complete list of our customer service standards -- as well as links to easily file a complaint online -- please see our complaint help web page. You can also call our Insurance Consumer Hotline toll-free at 1-800-562-6900.

We'll try our best to help.

Discipline

We all know people who have invested in $2,500 clothing racks. OK, the store called the equipment an exercise bike or a treadmill. But sitting idly in the bedroom with clothing draped over it, the apparatus is obviously a clothing rack. What a waste of money! If only these people had the discipline to take full advantage of their investment.

Recent studies performed by researchers at Duke University have proven that the above problem may not be shared by physicians. If a doctor purchases equipment, such as expensive heart-testing or imaging equipment, they use it. In fact, it appears that these doctors may be using their equipment regardless of whether the patient needs the testing or not.

That’s what I call discipline.

USA Today reported this past week about a Duke University study of 500 MRI scans that had been performed on patients with lower back pain. The researchers were trying to determine whether doctors who own the equipment order more tests than those who don’t. You bet they did. Almost twice as many normal results (106 vs. 57) were found on scans ordered by doctors with an economic incentive than by those who didn’t.

The article notes that MRI scanning equipment carries a price tag of over $1,000,000 and that the patient or insurer is charged about $2,000 per test. Once you’ve got the equipment, you might as well use it, just to be safe.

Consumer Reports carried a similar story in early November. Duke University researchers reviewed the health insurance records of 18,000 health patients. The original study was published in the Journal of the American Medical Association.

“…the researchers found that patients of doctors who billed for both technical and professional fees – an indication that the doctors owned the medical equipment themselves – were more than twice as likely to undergo a nuclear stress test and more than seven times as likely to undergo stress echocardiography than patients of doctors who did not bill for those fees.”


A July 25th article in Washington Post notes that unnecessary tests don’t just waste money. There are also the risks of false positives that lead to further unneeded procedures including surgery.

Whether we are discussing lower back pain or heart problems, the patient is always his/her best advocate. But when you are in pain or when you have been diagnosed with a heart problem and coming to terms with your own mortality, are you going to ask the doctor if a test is really necessary? Or, are you going to do what you are told, especially if the test is being paid by your insurance?

This is part of cost containment. It doesn’t matter whether insurers or the government is paying the bill. An aging population is going to have more conditions, not less. And doctors, unchecked, are going to order more tests, not less.

There are doctors that will point to the risk of lawsuits as for their motivation to order so many tests. Yes, tort reform is also an important part of cost containment.

As of today, December 5, 2011, there has been precious little done to control costs. The authors of the Patient Protection and Affordable Care Act may not understand why the price of health care continues to rise. But then again, there are lots of suburbanites who don’t understand why they haven’t lost any weight. They bought the StairMaster. It is in their bedroom. Under the towels.

DAVE

www.bcandb.oom

Fitting distributions with R

Fitting distribution with R is something I have to do once in a while, but where do I start?

A good starting point to learn more about distribution fitting with R is Vito Ricci's tutorial on CRAN. I also find the vignettes of the actuar and fitdistrplus package a good read. I haven't looked into the recently published Handbook of fitting statistical distributions with R, by Z. Karian and E.J. Dudewicz, but it might be worthwhile in certain cases, see Xi'An's review. A more comprehensive overview of the various R packages is given by the CRAN Task View: Probability Distributions, maintained by Christophe Dutang.

How do I decide which distribution might be a good starting point?

I came across the paper Probabilistic approaches to risk by Aswath Damodaran. In Appendix 6.1 Aswath discusses the key characteristics of the most common distributions and in Figure 6A.15 he provides a decision tree diagram for choosing a distribution:


JD Long points to the Clickable diagram of distribution relationships by John Cook in his blog entry about Fitting distribution X to data from distribution Y . With those two charts I find it not too difficult anymore to find a reasonable starting point.

Once I have decided which distribution might be a good fit I start usually with the fitdistr function of the MASS package. However, since I discovered the fitdistrplus package I have become very fond of the fitdist function, as it comes with a wonderful plot method. It plots an empirical histogram with a theoretical density curve, a QQ and PP-plot and the empirical cumulative distribution with the theoretical distribution. Further, the package provides also goodness of fit tests via gofstat.

Suppose I have only 50 data points, of which I believe that they follow a log-normal distribution. How much variance can I expect? Well, let's experiment. I draw 50 random numbers from a log-normal distribution, fit the distribution to the sample data and repeat the exercise 50 times and plot the results using the plot function of the fitdistrplus package.


I notice quite a big variance in the results. For some samples other distributions, e.g. logistic, could provide a better fit. You might argue that 50 data points is not a lot of data, but in real life it often is, and hence this little example already shows me that fitting a distribution to data is not just about applying an algorithm, but requires a sound understanding of the process which generated the data as well.

Interactive presentations with deck.js

Data analysis is often an iterative and interactive process. However, when I present about this subject, I feel often limited by the presentation software I use. It doesn't matter if I use LaTeX/PDF, PowerPoint or Keynote. In all cases it is either very difficult or impossible to include interactive charts, such as Flash or SVG charts. As a result I have to switch between various applications during the talk. This can be fun, but quite often it is not.

The other day I came across a presentation by Christopher Gandrud. Christopher had used deck.js, a JavaScript library for building HTML presentations by Caleb Troughton.

This looked like an interesting approach to me and fortunately the learning curve was not too steep, although I am by no means an html or JavaScript expert. So I created my first deck.js presentation based on the content of previous googleVis presentations. For the first time I can embed videos, Flash and SVG charts without using lots of different apps. I am actually quite pleased by the result, see here: Getting started with googleVis


Now imagine a presentation hosted on a server with R installed! You could combine your slides with R using one of the following packages R.rsp, brew, Rook, etc and run live demos, without opening a console.

Heads You Win, Tails I Lose

It is November in Northeast Ohio. Homeowners are faced with an annual decision – buy a new snow shovel, buy/tune up the snow plow, or hire a plowing service. I was lucky enough to have always had a snow service when I had my house in Shaker Heights. For $250 a guy in a pick-up truck would magically appear every time there was as little as 2” of snow on my drive. He would clear the drive and make it safe for me and my family. Sometimes he would even sweep the snow off the walkway. $250 for six months. If it snowed only three times - $250. If it snowed thirty times - $250. I wasn’t purchasing the number of times he visited. I was buying peace of mind and security. And if it never snowed in Shaker Heights? Let’s not be silly. One year’s easy winter would surely be followed by a snow belt classic.

If you believe, as I do, that the Patient Protection and Affordable Care Act (PPACA) is designed to change who pays for health care in our country, then you had been waiting anxiously for yesterday’s decision from the Obama administration. Florida has aggressively fought the President’s legislation from day one. The latest salvo was a special request for a waiver of the 80% Minimum Loss Ratio (MLR) regulation. This special waiver has required a mound of paperwork and nearly a year of preparation.

And the verdict from the Centers for Medicare and Medicaid Services (CMS) was (drum roll please) - - - Come back in 30 days.

First, what is an 80% Minimum Loss Ratio? In the simplest of terms it means that for ever dollar of premium an insurance company receives, it must spend 80 cents on health care claims. That leaves 20 cents for taxes, administration, reserves, marketing, advertising, and profits. If the consumer has a good year and has fewer claims, the law requires the insurer to issue a rebate of the excess premiums. If the consumer has a really bad year, oh well.

I think you can see where this is going. Most of my clients are small businesses with fewer than ten employees. Some have only one or two employees. Many of my groups have little to no claims per year, while several of them more than make up the difference.

If a small business consists of three families, each paying $1,000 per month, we have an annual premium of $36,000. What happens if one of the spouses has a quadruple by-pass at $180,000? Where does the insurer get that money if it is returning excess premiums each year to the healthy clients?

The goal is to have a loss ratio between 65% - 80%. This goal is for the entire book of business, not on a client by client basis. We are pooling the risk, sharing the possibility of major accidents and illnesses among a large group of people. The MLR regulation effectively ends that. And in the end, it effectively ends private major medical insurance.

Insurers are threatening to pull out of the states that don’t get the federal waiver. At the very least, they will be forced to significantly restructure their product offerings. It is not an idle threat. This is all part of the process that began in March of 2010.

The Supreme Court will soon hear arguments about the individual mandate, a concept championed by Newt Gingrich and Bob Dole in the early 1990’s and pilloried by the Republicans today. This is a side-show. The Minimum Loss Ratio rulings will have far more impact on who pays for your healthcare in 2015.

I could have purchased a “pay as I go” snow service when I was a homeowner. What I couldn’t afford back then and can’t afford now is “pay as I go” healthcare.

DAVE

www.bcandb.com

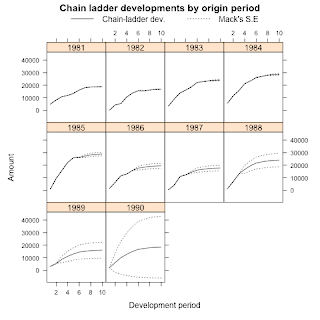
Stochastic reserving with R: ChainLadder 0.1.5-1 released

Today we published version 0.1.5-1 of the ChainLadder package for R. It provides methods which are typically used in insurance claims reserving to forecast future claims payments.

Claims development and chain-ladder forecast of the RAA data set using the Mack method
The package started out of presentations given at the Stochastic Reserving Seminar at the Institute of Actuaries in 2007, 2008 and 2010, followed by talks at CAS meetings in 2008 and 2010.

Initially the package came with implementations of the Mack-, Munich- and Bootstrap Chain-Ladder methods. Since version 0.1.3-3 it also provides general multivariate chain ladder models by Wayne Zhang. Version 0.1.4-0 introduced new functions on loss development factor fitting and Cape Cod by Daniel Murphy following a paper by David Clark. Version 0.1.5-0 has added loss reserving models within the generalized linear model framework following a paper by England P. and Verrall R. (1999) implemented by Wayne Zhang.

For more details see the project web site: http://code.google.com/p/chainladder/ and an early blog entry about R in the insurance industry.

Changes in version 0.1.5-1:
  • Internal changes to plot.MackChainLadder to pass new checks introduced by R 2.14.0.
  • Commented out unnecessary creation of 'io' matrix in ClarkCapeCod function. Allows for analysis of very large matrices for CapeCod without running out of RAM. 'io' matrix is an integral part of ClarkLDF, and so remains in that function.
  • plot.clark method
    • Removed "conclusion" stated in QQplot of clark methods.
    • Restore 'par' settings upon exit
    • Slight change to the title
  • Reduced the minimum 'theta' boundary for weibull growth function
  • Added warnings to as.triangle if origin or dev. period are not numeric

Here is a little example using the googleVis package to display the RAA claims development triangle:

library(ChainLadder)
library(googleVis)
data(RAA) # example data set of the ChainLadder package
class(RAA) <- "matrix" # change the class from triangle to matrix
df <- as.data.frame(t(RAA)) # coerce triangle into a data.frame
names(df) <- 1981 : 1990
df$dev <- 1:10
plot(gvisLineChart(df, "dev", options=list(gvis.editor="Edit me!", hAxis.title="dev. period")))

An Angry Mob

The National Journal, a non-partisan Washington based news magazine, published the story as if it was news. Poll: Majority of Voters Want Medicare Funding Left Untouched The first paragraph noted that 83 percent of the respondents oppose cuts to Medicare and higher beneficiary copayments. 70 percent believe that the government should be more active in fighting waste, fraud, and abuse in both Medicare and Medicaid. It wasn’t until the second paragraph that we got the rest of the story.

The poll was commissioned by Fight Fraud First. One of the members of the collection of groups that created Fight Fraud First just happens to be AARP, the same organization that sponsors an endless series of television spots scaring and/or rallying senior citizens.

So we have three questions.

  1. Is it at all surprising that 83% of the population (assuming that the poll wasn’t weighted with seniors!) want as much money and benefits as they can get with little or no charges?

  2. Would you expect a poll conducted by an organization named Fight Fraud First to release the results of a poll that didn’t strongly endorse the concept of fighting fraud first?

  3. Was this news?


Since the first two questions are obvious, allow me to answer the third. NO!

We want painless solutions to all of our problems and we are at least 83% convinced that someone else should pay for the debts we have all created. I’m not sure if this mindset can be traced to the concept of paying for two wars by shopping or if it is simply more prevalent in today’s society, but it is everywhere we look.

I was in New York City a few weeks ago and had a chance to visit the Occupy Wall Street. Yes, it did remind me of the anti-war protests of the late sixties and early seventies. But at the risk of ticking off most of my readers, I have to tell you that there is little difference between the Occupy Wall Street crowd, a Tea Party rally, and a group of Libyan soldiers firing their rifles straight up into the air with little regard to where the bullets will land. Within each group is a small core that understands and can discuss the issues. There is also a larger faction that has a propagandist’s view of the group’s concerns, but is totally committed for the moment. The rest, the vast majority, have nothing better to do and no place better to be.

The links in the above paragraph will provide you with plenty of laughs whether you are on the Right or the Left.

In a perfect world, in the ideal democracy, those masses gathering at Tea Party rallies and camping out at Occupy sites around the country would be engaged in intellectual policy debates. These citizens would be working hard to find solutions to our country’s economic woes.

That is not happening.

What we have, instead, are people desperately attempting to assert their relevance. It appears to be very easy to confuse one’s self-interest with what is allegedly in the U.S.’s best interest. And this leads us to the current health care debate.

The Patient Protection and Affordable Care Act (PPACA) attempts to change who pays for health care, but does nothing to control the cost of care. Changing the payer doesn’t solve our problem of spiraling health care costs.

The current financial debacle has forced some in Congress to start thinking about reigning in costs. This has resulted in the special interest groups to snap into action.

  • The American Hospital Association has a woman staring into the camera, and our souls, decrying any cuts that could endanger her father’s health.

  • AARP’s commercial supposedly speaks for 50 million seniors who are united to oppose any cuts and will vote, as one, against anyone who dares oppose them.

  • The A.M.A. (American Medical Association) is spending big bucks to remind you that doctors are on your side.


Luckily, as Ohio residents we have been spared the finger pointing and shouting of the Republican presidential primary ads. Better Iowa than us.

The next year is very important. Will the PPACA survive? My guess is still Yes. The rules and regulations are being written and imposed now. It will be very difficult to simply reverse all of this, even if anyone wanted to, in January 2013. What you need to watch, what you need to ask are what cost containment measures, if any, are being implemented?

There is a lot of noise out there. People are marching to retain the life they think they have. Or they might be marching to claim their share of the American largesse that has eluded them. Many of these same people will soon be whipped into action to save their local hospitals or to protest a cut in nurses’ wages. The one constant throughout all of this will be the absence of personal sacrifice.

Ask people to pay more? That might create an angry mob.

DAVE

www.bcandb.com

Installing R 2.14.0 on an iBook G4 running Mac OS 10.4.11

My 12" iBook G4 is celebrating its 8th birthday today! Time for a little present. How about R 2.14.0?

The iBook is still in daily use, mostly for browsing the web, writing e-mails and this blog; and I still use it for R as well. For a long time it run R 2.10.1, the last PowerPC binary version available on CRAN for Mac OS 10.4.11 (Tiger).

But, R 2.10.1 is a bit dated by now and for the development of my googleVis package I require at least R 2.11.0. So I decided to try installing the most recent version from source, using Xcode 2.5 and TeXLive-2008.

R 2.14.0 is expected to be released on Monday (31st October 2011). The pre-release version is already available on CRAN. I assume that the pre-release version is pretty close to the final version of R 2.14.0, so why wait?

It was actually surprisingly easy to compile the command line version of R from sources. The GUI would be a nice to have, but I am perfectly happy to run R via the Terminal, xterm and Emacs. However, it shouldn't be a surprise that running configure, make, make install on a 800 Mhz G4 with 640MB memory does take its time.
Below you will find the building details. Please feel free to get in touch with me, if you would like access to my Apple Disk Image (dmg) file. You find my e-mail address in the maintainer field of the googleVis package.

Building R from source on Mac OS 10.4 with Xcode 2.5 (gcc-4.0.1)


Before you start, make sure you have all the Apple Developer Tools installed. I have Xcode installed in /Developer/Applications.

From the pre-release directory on CRAN I downloaded the file R-rc_2011-10-28_r57465.tar.gz.

After I downloaded the file I extracted the archive and run the configure scripts to build the various Makefiles. To do this, I opened the Terminal programme (it's in the Utilities folder of Applications), changed into the directory in which I stored the tar.gz-file and typed:
tar xvfz R-rc_2011-10-28_r57465.tar.gz
cd R-rc
./configure
This process took a little while (about 15 minutes) and at the end I received the following statement:
R is now configured for powerpc-apple-darwin8.11.0

Source directory: .
Installation directory: /Library/Frameworks

C compiler: gcc -std=gnu99 -g -O2
Fortran 77 compiler: gfortran -g -O2

C++ compiler: g++ -g -O2
Fortran 90/95 compiler: gfortran -g -O2
Obj-C compiler: gcc -g -O2 -fobjc-exceptions

Interfaces supported: X11, aqua, tcltk
External libraries: readline, ICU
Additional capabilities: NLS
Options enabled: framework, shared BLAS, R profiling, Java

Recommended packages: yes
With all the relevant Makefiles in place I could start the build process via:
make -j8
Now I had time for a cup of tea, as the build took about one hour. Finally, to finish the installation, I placed the new R version into its place in /Library/Frameworks/ by typing:
sudo make install
Job done. Let's test it:
Grappa:~ Markus$ R

R version 2.14.0 RC (2011-10-28 r57465)
Copyright (C) 2011 The R Foundation for Statistical Computing
ISBN 3-900051-07-0
Platform: powerpc-apple-darwin8.11.0 (32-bit)

R is free software and comes with ABSOLUTELY NO WARRANTY.
You are welcome to redistribute it under certain conditions.
Type 'license()' or 'licence()' for distribution details.

Natural language support but running in an English locale

R is a collaborative project with many contributors.
Type 'contributors()' for more information and
'citation()' on how to cite R or R packages in publications.

Type 'demo()' for some demos, 'help()' for on-line help, or
'help.start()' for an HTML browser interface to help.
Type 'q()' to quit R.

> for(i in 1:8) print("Happy birthday iBook!")
[1] "Happy birthday iBook!"
[1] "Happy birthday iBook!"
[1] "Happy birthday iBook!"
[1] "Happy birthday iBook!"
[1] "Happy birthday iBook!"
[1] "Happy birthday iBook!"
[1] "Happy birthday iBook!"
[1] "Happy birthday iBook!"


The installation of additional packages worked straightforward via install.packages(c("vector of packages")), though it took time, as everything was build from sources. This it what it looks like on my iBook G4 today:
> installed.packages()[,"Version"]
ChainLadder GillespieSSA Hmisc ISOcodes KernSmooth MASS
"0.1.5-0" "0.5-4" "3.8-3" "2011.07.31" "2.23-6" "7.3-16"
Matrix R.methodsS3 R.oo R.rsp R.utils RColorBrewer
"1.0-1" "1.2.1" "1.8.2" "0.6.2" "1.8.5" "1.0-5"
RCurl RJSONIO RUnit Rook XML actuar
"1.6-10" "0.96-0" "0.4.26" "1.0-2" "3.4-3" "1.1-2"
base bitops boot brew car class
"2.14.0" "1.0-4.1" "1.3-3" "1.0-6" "2.0-11" "7.3-3"
cluster coda codetools coin colorspace compiler
"1.14.1" "0.14-4" "0.2-8" "1.0-20" "1.1-0" "2.14.0"
data.table datasets digest flexclust foreign gam
"1.7.1" "2.14.0" "0.5.1" "1.3-2" "0.8-46" "1.04.1"
ggplot2 googleVis grDevices graphics grid iterators
"0.8.9" "0.2.10" "2.14.0" "2.14.0" "2.14.0" "1.0.5"
itertools lattice lmtest mclust methods mgcv
"0.1-1" "0.20-0" "0.9-29" "3.4.10" "2.14.0" "1.7-9"
modeltools mvtnorm nlme nnet parallel party
"0.2-18" "0.9-9991" "3.1-102" "7.3-1" "2.14.0" "0.9-99994"
plyr proto pscl reshape rpart sandwich
"1.6" "0.3-9.2" "1.04.1" "0.8.4" "3.1-50" "2.2-8"
spatial splines statmod stats stats4 strucchange
"7.3-3" "2.14.0" "1.4.13" "2.14.0" "2.14.0" "1.4-6"
survival systemfit tcltk tools utils vcd
"2.36-10" "1.1-8" "2.14.0" "2.14.0" "2.14.0" "1.2-12"
zoo
"1.7-5"

Update (3 June 2012)

Just updated my R installation to R-2.15.0 and the above procedure still worked. But I had to be patient. It took at least an hour to compile R and the core packages.
R version 2.15.0 Patched (2012-06-03 r59505) -- "Easter Beagle"
Copyright (C) 2012 The R Foundation for Statistical Computing
ISBN 3-900051-07-0
Platform: powerpc-apple-darwin8.11.0 (32-bit)

Update (1 June 2013)

Just updated my R installation to R-3.0.1 and the above procedure still worked. The iBook will be 10 years old soon and is still going strong. Not bad for such an old laptop.
R version 3.0.1 (2013-05-16) -- "Good Sport"
Copyright (C) 2013 The R Foundation for Statistical Computing
Platform: powerpc-apple-darwin8.11.0 (32-bit)

Using Sweave with XeLaTeX

Using R with LaTeX via Sweave is a great way to create reproducible output. However, using specific fonts, e.g. your corporate fonts, can be painful with pdflatex. Over the last few weeks I have fallen in love with the TeX format XeLaTeX and its XeTeX engine.

With XeLaTeX I had to overcome some hurdles, which I would like to share here:

  • attaching files,
  • trimming and clipping images,
  • learning how to use the tikzDevice package.


The Sweave file of the above document is attached to the PDF-file itself, but you can also find it on github: SweaveXeLaTeXExample.Rnw.

Pulling The Plug

This blog has campaigned for transparency, honesty, and basic accounting principles. This isn’t a Democrat or a Republican issue. This isn’t Left or Right. Asking for our elected officials to perform at a higher level may, at times, appear child-like and naïve, but why would we work so hard, investing our time and money, if we didn’t believe that we were trying to help our country find our best leaders?

Flying to New York this past weekend gave me extra time to read. I need to share an opinion piece from The New York Times and a memo from Health and Human Services. This will take a few minutes. It will be time well spent.

Jane Gross, author of A Bittersweet Season: Caring for Our Aging Parents and Ourselves, discussed the last years of her mother’s life in The New York Times. The article, How Medicare Fails the Elderly, detailed the medical care Medicare paid and the hundreds of thousands of dollars of services that depleted the family’s savings. It was brutal. Ms. Gross lays bare the inefficiencies of a system that rewards unwarranted expensive procedures that may more successfully enhance the medical provider’s life than the patient’s. Please read the article. It is a difficult read and there wasn’t a happy ending.

The memo is also about an ending. Kathy Greenlee, CLASS Administrator, sent a memo to the Secretary of Health and Human Services, Kathleen Sebelius, recommending that the program be suspended. CLASS is the acronym for the Community Living Assistance Services and Support Act. Ms. Greenlee was forced to report that there was no logal way to make this program work.

This was not a shock.

The CLASS Act was an important part of the Patient Protection and Affordable Care Act (PPACA). It was important to consumers because it promised to help pay for long term care. It was even more important to the President because, through a bit of accounting sleight of hand, the CLASS Act generated a $70 billion dollar surplus during the first ten years. That money would cover $70 billion dollars of deficit from the PPACA. See, revenue neutral!

Ms. Greenlee was forced to admit that the numbers did not add up. A voluntary program that didn’t have any underwriting couldn’t be actuarially sound the way the law was written. With no public funding available and healthy people not forced to participate, the independent actuaries predicted disaster. Thankfully, the program will be pulled now before any more money is wasted.

The need for long term care planning and the cost of that care are the themes that tie these two readings together. My fixation on transparency is why I have brought them to your attention.

DAVE

www.bcandb.com

R related books: Traditional vs online publishing

How many R related books have been published so far? Who is the most popular publisher? How many other manuals, tutorials and books have been published online? Let's find out.

A few years ago I used the publication list on r-project.org as an argument with the IT department that R is an established statistical programming language and that they should allow me to install it on my PC. I believe at the time there were about 20 R related books available.

A recent post on Recology pointed me to a talk given by Ed Goodwin at the Houston R user group meeting about regular expressions in R, something I always wanted to learn properly, but never got around to do.

So let's see, if we can manage to extract the information of published R books and texts from r-project.org, with what we learned from Ed about regular expressions in R.
Read more »

Perfectibility

Prohibition was about human perfectibility, that humans can be perfected. You could have the perfect marriage if you could eliminate alcohol. from Ken Burns' Prohibition

I watched Ken Burns’ Prohibition on PBS last night. A group of people decided what would be best for everyone else. Armed with moralistic fervor inspired in equal parts by their G-d and their fear of others (immigrants and non-whites), they campaigned to eliminate someone else’s vice. And they succeeded in part until they failed entirely.

There is a shocking parallel between the Prohibition movement of one hundred years ago and today’s health care debate.

Part of what drives the current discussion is this concept of perfectibility. If only the profit motive was removed from the delivery of health care, if access was unlimited, then no one would die before his/her time.

  • Can you really remove profit from health care?

  • How unlimited is unlimited?

  • When is it our time?


The simple answers are - NO!, Who knows?, and Gosh, what a silly question.

Doctors need to be paid. Medical equipment suppliers need profits to build their businesses. Pharmaceutical companies risk millions to develop new compounds that may cure illnesses and alleviate pain and suffering. The insurers play a role in all of this, too. Eliminate them, the market organizers, and their function will have to be performed by the government. You may debate whether that would be more efficient that the businesses, but to deny that money is a key element in the delivery of health care is to deny reality.

Heart transplants? Liver transplants? Any age? Any health status? Should a 75 year old overweight diabetic with bad lungs from years of smoking stand in the front of the line waiting for a new heart? There have always been, and always will be, some limits to access. What we have not had, as a country, is an open, honest discussion about limits. We are not talking about death panels. We are talking about realistic expectations. What is society’s responsibility to the sick and injured?

The last part of this is the most difficult. Who amongst us wants to address our own mortality? No amount of health care would keep us alive forever. We are not machines. Yet there are people who claim that changing our health care delivery system will magically enhance our life expectancy.

Which returns us to this concept of human perfectibility. Can we improve the payment and delivery of health care in the United States? Absolutely! The first steps will be transparency and an honest discussion about achievable goals.

Now would be a good time to start.

Setting the initial view of a motion chart in R

Following on from my article about accessing and plotting World Bank data with R I want to talk about how to change the initial view of a motion chart.

Over the last couple of weeks I have been asked a view times how to do this. For instance Stephen O'Grady wanted to create a motion chart, which shows initially a line chart, rather than a bubble chart.

Changing the initial settings of a motion chart is actually quite easy, if you know how to. The trick is to use the state argument in the list of options of gvisMotionChart.

As a case study I will use the World Bank data set and try to do some homework given by Duncan Temple Lang in his course on introduction to statistical computing course. Duncan asked his students to query the World Bank data base to create a line chart, which would show the number of internet users per 1000 in Africa over time. Further, he would like to see a legend next to the chart to identify which country is which and tooltips for each curve to identify the country.

A motion chart, displayed as a line chart, would do the trick.

Okay, getting the data is easy, thanks to the WDI package, or via a direct download, and so it is to create a motion chart with bubbles. Interactively I can change the bubble chart into a line chart, I can select some countries and change the y-axis to log-scale. However, when I reload the page I am back to square one: a bubble chart. So the idea is to pass the changed chart settings on to the initial plot. I find those settings, of the current view, as a string in the advanced tab of the settings window. I click on the wrench symbol in the bottom right hand corner of a motion chart to access this window.

Screen shot the settings window of a motion chart

Next I copy this string and paste it into the state argument of the options list. Note the line break at the beginning and at the end of the state string in the example. Alternatively I can add \n to both side of the state string.

Here is an example, where I pre-selected Sierra Leone and Seychelles (countries with the lowest and highest number of internet users) together with Africa, North Africa and Sub-Saharan Africa (all income levels). You find the R code below to replicate the plot.

What does the data tell you? Play around with the graph, e.g. change it to a column graph, deselect all countries and change the y-axes to linear again, and hit the play button. How could we improve the plot?
Read more »

Accessing and plotting World Bank data with R

Over the past couple of days I played around with the data sets of the World Bank, and I have to admit that I am blown away by it. It is amazing, to see what is available on their web site and it is worth visiting their Data Visualisation Tools page. It is fantastic that they provide an API to their data. They have used it to build an iPhone App which is pretty cool. You can have the world's data in your pocket.

In this post I will show you how we can access data from the World Bank in R. As an example we create a motion chart, in the Hans Rosling style, as you find it on the Google Public Data Explorer site, which also uses data from the World Bank. Doing this, should give us the confidence that we understand the World Bank's interface. You can find this example as demo WorldBank as part of the googleVis package from version 0.2.10 onwards.

So let's try to replicate the initial plot of the Google Public Data Explorer, which shows fertility rate against life expectancy for each country from 1960 to today, whereby the countries are represented as bubbles, with the size reflecting the population and the colour the region.
Read more »

R in the insurance industry

Let's talk about R in the insurance industry today.  David Smith's blog entry reminded me about our poster at the R user conference in Warwick in August 2011:
Using R in Insurance
We presented examples on how R can be used in the insurance industry. We had a lot of fun presenting our poster. By accident we had printed the poster with quite a bit of access white space to the right. So we asked everyone who came along to sign it and by the end of the evening we had over 100 signatures!


For the historians under the readers, here is my five year old poster from GIRO in Vienna 2006.


Poster session at useR! 2011 in Warwick, UK
Yesterday Wayne Zhang, with whom I collaborate on the ChainLadder package, released the first version of his new cplm package on CRAN.  The name cplm is short for compound Poisson linear models. The cplm package is for fitting Tweedie compound Poisson linear models using the Monte Carlo EM algorithm. The form of the models that are handled in the package are generalized linear models, mixed-effect models and Bayesian models. For non-Bayesian models, maximum likelihood estimations are obtained for all parameters in the model, especially for the index parameter. Estimation for the Bayesian model is performed by Markov Chain Monte Carlo simulations. These models find their application in actuarial science, see also his paper.  

Here are a few more insurance related packages:
  • ChainLadder - Reserving methods in R. The package provides Mack-, Munich-, Bootstrap, and Multivariate-chain-ladder methods, as well as the LDF Curve Fitting methods of Dave Clark and GLM-based reserving models.
  • cplm - Monte Carlo EM algorithms and Bayesian methods for fitting Tweedie compound Poisson linear models.
  • lossDev - A Bayesian time series loss development model. Features include skewed-t distribution with time-varying scale parameter, Reversible Jump MCMC for determining the functional form of the consumption path, and a structural break in this path.
  • actuar: Loss distributions modelling, risk theory (including ruin theory), simulation of compound hierarchical models and credibility theory.
  • fitdistrplus: Help to fit of a parametric distribution to non-censored or censored data
  • favir: Formatted Actuarial Vignettes in R. FAViR lowers the learning curve of the R environment. It is a series of peer-reviewed Sweave papers that use a consistent style.
  • mondate: R packackge to keep track of dates in terms of months
  • lifecontingencies - Package to perform actuarial evaluation of life contingencies
Other useful documents:
Help! There is a special interest group for R in insurance: